At Exeter College we are tracking emissions and taking steps to reduce them. Thanks to the efforts of students, staff and Fellows, substantial reductions have been made and we are working hard to make further cuts. We will announce our target for achieving net zero carbon once we have a clear idea of the scale of that undertaking and a detailed plan for achieving it.
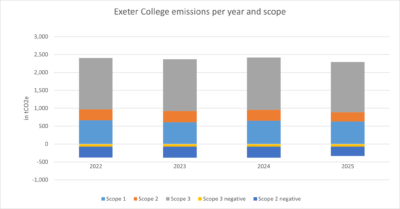
The graph above shows our currently estimated emissions since 2022 by scope. Our Scope 1 direct emissions were 629 tonnes Carbon Dioxide equivalent (tCO2e) in the 20251 financial year, having fallen from 746 tCO2e in 2019. Our Scope 2 indirect emissions fell from 489 tCO2e in 2019 to 258 tCO2e in the 2025 financial year. These Scope 2 emissions were offset by our procurement of zero-carbon electricity, as made visible through the Scope 2 negative emissions above. Our covered Scope 3 emissions fell from 1472 tCO2e to 1054 tCO2e over this time period. For more information about what we mean by Scope 1, 2 and 3 emissions click here.
While our Scope 1 and 2 emissions and our Scope 3 emissions for utilities and waste are complete, the figures for procurement and travel are initial estimates. We are working on including more of our Scope 3 emissions as better data become available. The graph above shows the currently estimated makeup of Exeter College emissions by category of activity across all scopes. We expect procurement to be a larger part of our emissions and have not accounted for our endowment in these figures as yet. Unless otherwise stated, the conversion factors for emissions are based on the government’s official figures for the given year (2019, 2021, 2022, 2023, 2024, 2025).


Scope 1 emissions
Gas
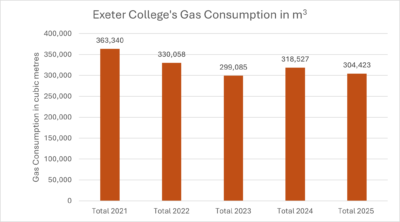
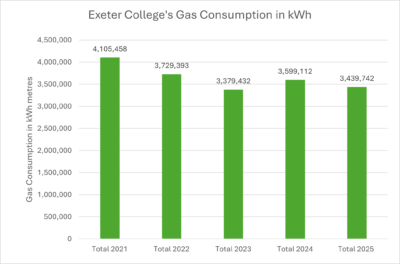
Exeter College’s scope 1 emissions were 629 tCO2e for the 2024/25 academic year. Exeter College has reduced its gas consumption by 17.08% since 2019. As visible in the graph above the College’s gas consumption was 304,423m3 in the 2024-25 academic year displaying in a reduction of 2% from 2023-24 consumption.
Diesel
The College owns a 2.4 litre diesel van which we have estimated produces annual emissions of 1 tonne of CO2e based on the annual milage of approximately 2,160.
Scope 2 emissions
Electricity
Exeter College has reduced electricity consumption by 6.71% since 2022. As visible in the graph below the College’s electricity consumption was 1,459,350 kwh in the 2024-25 academic year, displaying a 5.8% decrease from the 2023-24 academic year.
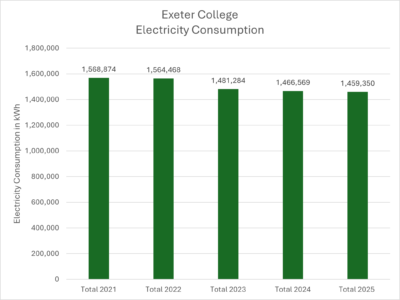
The College’s scope 2 emissions remain zero due to our long-standing commitment to purchasing zero carbon electricity when emissions are calculated via a market-based approach. By procuring zero carbon electricity the College avoided the production of 333 tCO2e in 2021, 303 tCO2e in 2022, 307 tCO2e in 2023, 304 tCO2e in 2024 and 258 tCO2e in 2025. Nonetheless, our electricity use in 2025 caused upstream emissions (scope 3) amounting to 100 tCO2e, which is around 5% of our total emissions when including student travel and 5% without.
Scope 3 emission
Water
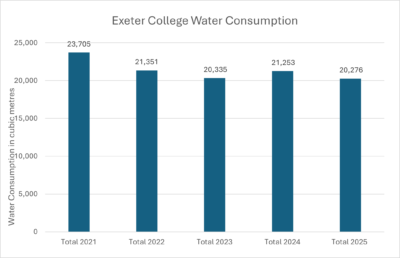
Exeter College has reduced its water consumption on its metered sites by 14.5% since 2021.
Water consumption was 20,785 cubic metres in 2023-24 and dropped down to 20,276 cubic meters in 2024-25, which is a reduction of 2.4%. In 2025 and 2024 water supply and treatment led to emissions of 7 tCO2e. This has fallen from 8tCO2e in 2023 9 tCO2e in 2022 and 10 tCO2e in 2021.
All our dry mixed recycling, food recycling, general waste, glass recycling and confidential paper waste is weighed on collection at our Main Site, Cohen Quad, Stapledon House and Exeter House, allowing us to track our waste monthly.
Emissions from non-hazardous and non-junk waste were 0.5 tCO2e in 2025 falling from 1 tCO2e in 2024 and 2 tCO2e in 2023 and 2024. While this is a small percentage of our total emissions, we are nonetheless committed to reducing this as it has wider impacts in terms of resource use and pollution. Find out more about our waste and recycling efforts here.
Procurement
Our waste figures highlight the amounts of materials produced for us, with at least 41 tCO2e upstream emissions related to the production of items that ended up in our glass, paper and dry mixed recycling waste streams in 2025. Our IT procurement was also responsible for around 6 tCO2e in 2023, based on conversion figures from a recent study (Lövehagen et al., 2023), a value we are using to estimate IT procurement in 2025 until a more comprehensive way of calculating this value becomes available.
The food-based carbon footprint is calculated by broad approximation. The calculation uses the College’s 2021 catering operations and is based on the equivalent of circa 19,200 day consumers at 5.2Kg/CO2e per day (source: “Food in a warming world: the changing foods on the British Plate”, WWF, 2018; which is broadly consistent with data from “Dietary greenhouse gas emissions of meat-eaters, fish-eaters, vegetarians and vegans in the UK” by Scarborough P. et al., Nuffield Department of Population Health, Oxford, 2014). This equates to 100 tonnes of CO2e from food in 2021 and this has been used as an estimate for following years until current information can be acquired.
These procurement emissions are only an initial estimate with large gaps in data remaining. Thus, the proportion of our total emissions will be higher than the 7% currently allocated to procurement (for the dataset including student travel) and 14% (for the dataset excluding student travel).
Transport and Travel
An initial estimate of our transport and travel emissions for College business travel lies at 8 tCO2e in 2025, which includes rail and air travel. In 2024 emissions from flights for College business amounted to 45 tCO2e. Based on the previous emissions calculations the College estimates domestic and international student travel based on 2021 data, using the methodology detailed below.
We have assumed that UK students travelled to Oxford by car, with a family member or friend dropping them in Oxford and then making the return trip home. For our calculations we included 100% of emissions for postgraduate students, rather than dividing their emissions equally between their University department and the College. For the purposes of estimating the CO2e emissions we assumed that the average return journey was 400 miles, equivalent to driving from Lancaster to Oxford and back. This equates to 174 tCO2e from our UK students travelling to and from Oxford (University of Oxford Carbon Accounting Tool 2020).
We assumed our international students on undergraduate and taught postgraduate courses made two return flights from their home country and that postgraduate students taking research degrees made one return flight from their country of origin. For our calculations we included 100% of emissions for postgraduate students, rather than dividing their emissions equally between their University department and the College. For the purposes of estimating emissions we assumed each student flew from the capital city of their country of residence to London and vice versa for return trips. This equates to 872 tCO2e from our international students travelling to and from the UK (University of Oxford Carbon Accounting Tool 2020).
We are continually working on gathering more robust travel data to assess the full impact of College associated travel.
Carbon removal
Land
Exeter owns and manages responsibly approximately 12 hectares of woodland and six hectares of grassland including a site of special scientific interest (SSSI). Together these absorbed approximately 74 tonnes of CO2e in 2025 (University of Oxford Carbon Accounting Tool 2020).
Standardised Reporting
Our Colleges Sustainability Officer worked with fellow College sustainability leads to build a colleges carbon emissions toolkit to help colleges calculate their emissions moving forward. This will mean colleges be able to calculate their emissions in a uniform way for the same period. The tool was created for the 2024-2025 academic year, aligning with University reporting, using the relative DEFRA carbon emissions conversion factors. Exeter College will be using the updated 2025-2026 version of the tool to calculate its emissions for the 2025-2026 academic year.