At Exeter College we are tracking emissions and taking steps to reduce them. Thanks to the efforts of students, staff and Fellows, substantial reductions have been made and we are working hard to make further cuts. We will announce our target for achieving net zero carbon once we have a clear idea of the scale of that undertaking and a detailed plan for achieving it.
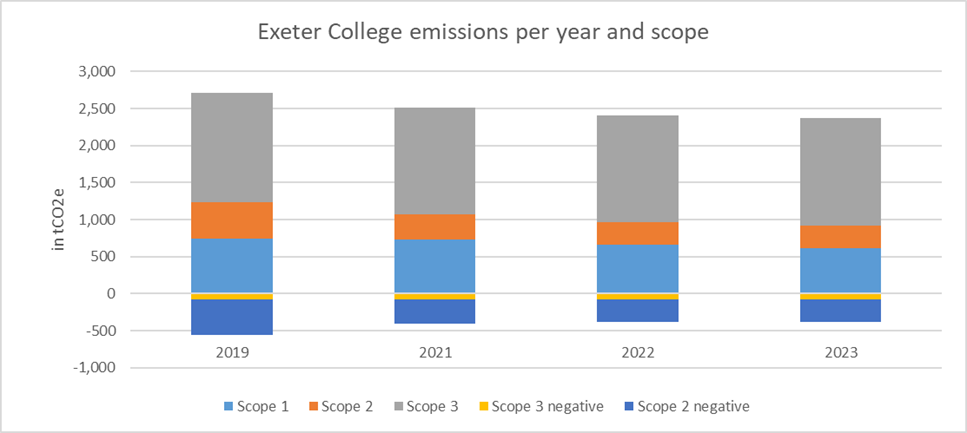
The graph above shows our currently estimated emissions since 2019 by scope (please note that figures for 2020 are not presented as that year was anomalous because of restrictions at the height of the Covid-19 pandemic). Our Scope 1 direct emissions were 611 tonnes Carbon Dioxide equivalent (tCO2e) in 2023, having fallen from 746 tCO2e in 2019. Our Scope 2 indirect emissions fell from 489 tCO2e in 2019 to 307 tCO2e in 2023. These Scope 2 emissions were offset by our procurement of renewable electricity, as made visible through the Scope 2 negative emissions above. Our covered Scope 3 emissions fell from 1472 tCO2e to 1453 tCO2e over this time period. For more information about what we mean by Scope 1, 2 and 3 emissions click here.
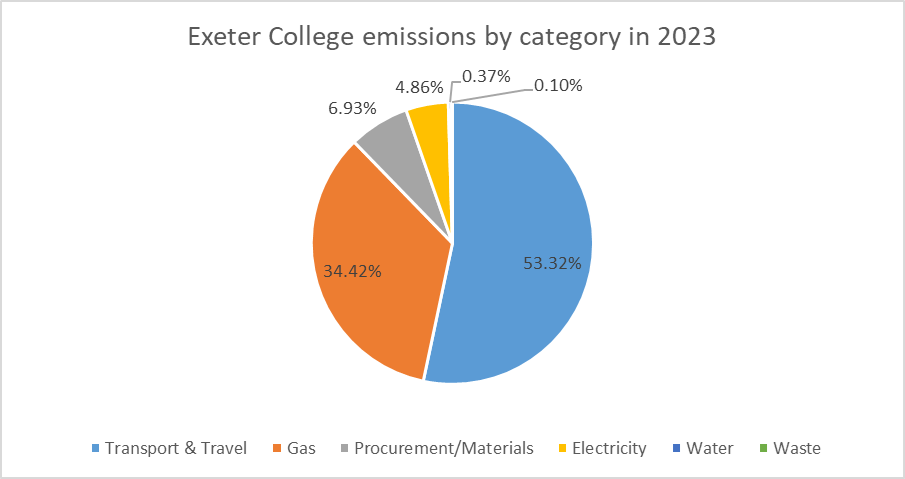
While our Scope 1 and 2 emissions and our Scope 3 emissions for utilities and waste are complete, the figures for procurement and travel are initial estimates. We are working on including more of our Scope 3 emissions as better data become available. The graph below shows the currently estimated makeup of Exeter College emissions by category of activity across all scopes. We expect procurement to be a larger part of our emissions and have not accounted for our endowment in these figures as yet. Unless otherwise stated, the conversion factors for emissions are based on the government’s official figures for the given year (2019, 2021, 2022, 2023).
At this time we are still collecting data to report on our 2024 emissions, this page will be updated in due course.
Scope 1 emissions
Gas
Exeter College has reduced gas consumption by 18.53% since 2019, with year-on-year reductions above 9% in both 2022 and 2023. As visible in the graph below the College’s gas consumption was 367,114 m3 in 2019. In 2021 this slightly fell to 363,688m3 and in 2022 gas use was reduced substantially to 335,055m3. In 2023 College gas use fell under the 300,000 m3 mark.
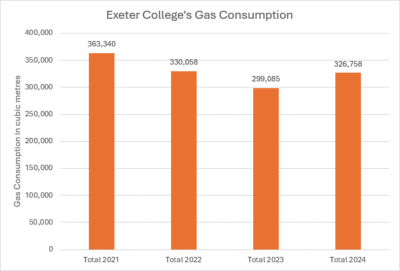
Thus, the College’s Scope 1 emissions from gas fell from 745 tCO2e in 2019 to 734 tCO2e in 2021, 665 tCO2e in 2022 and 610 tCO2e in 2023. In addition, our gas use caused upstream Scope 3 emissions of 101 tCO2e in 2023, together accounting for over 34% of our estimated emissions in the last calendar year.
Diesel
The College owns a 2.4 litre diesel van which we have estimated produces annual emissions of 1 tonne of CO2e based on between 1,469 and 1,756 miles driven per year.
Scope 2 emissions
Electricity
Exeter College has reduced electricity consumption substantially since 2019 with a year-on-year drop by 5.32% in 2023. As the graph below shows, electricity consumption was 1,564,468 kWh in 2022 and dropped down to 1,481,284 in 2023.
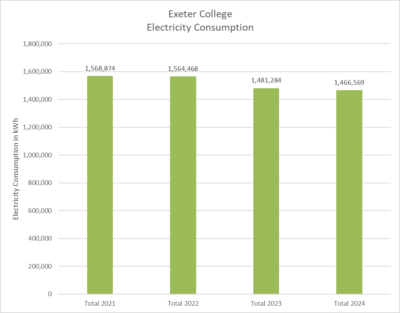
By procuring electricity generated from renewable sources the College avoided the production of 489 tCO2e in 2019, 333 tCO2e in 2021, 303 tCO2e in 2022 and 307 tCO2e in 2023. Nonetheless, our electricity use in 2023 caused upstream emissions amounting to 100 tCO2e, which is around 5% of our total emissions. This has fallen from 116 tCO2e in 2019, 124 tCO2e in 2021 and 107 tCO2e in 2022.
Scope 3 emission
Water
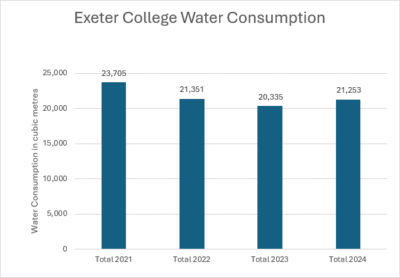
As visible in the graph below, Exeter College used 20,335 m3 of metered mains water in 2023. This is a slight reduction from the 21,351 m3 of metered mains water consumed in 2022, which followed larger reductions from 23,705 m3 of water in 2021 and 43,672 m3 of water in 2018-19. Emissions from water supply and treatment have thus fallen from 46 tCO2e in 2019 to 8 tCO2e in 2023.
Waste
All our dry mixed recycling, food recycling, general waste, glass recycling and confidential paper waste is weighed on collection at our Main Site, Cohen Quad, Stapledon House and Exeter House, allowing us to track our waste monthly.
Emissions from our weighed waste caused 2 tCO2e downstream emissions in 2022 and 2023. These emissions figures only account for waste collection, as emissions from recycling are taken into account in procurement in the government’s conversion figures. While this is a tenth of a percent of our total emissions, we are nonetheless committed to reducing this as it has wider impacts in terms of resource use and pollution. Find out more about our waste and recycling efforts here.
Procurement
Our waste figures highlight the amounts of materials produced for us, with at least 37 tCO2e upstream emissions related to the production of items that ended up in our glass, paper and dry mixed recycling waste streams in 2023. Our IT procurement was also responsible for around 6 tCO2e in 2023, based on conversion figures from a recent study (Lövehagen et al., 2023).The food-based carbon footprint is calculated by broad approximation. The calculation uses the College’s 2021 catering operations and is based on the equivalent of circa 19,200 day consumers at 5.2Kg/CO2e per day (source: “Food in a warming world: the changing foods on the British Plate”, WWF, 2018; which is broadly consistent with data from “Dietary greenhouse gas emissions of meat-eaters, fish-eaters, vegetarians and vegans in the UK” by Scarborough P. et al., Nuffield Department of Population Health, Oxford, 2014). This equates to 100 tonnes of CO2e from food in 2021.
These procurement emissions are only an initial estimate with large gaps in data remaining. Thus, the proportion of our total emissions will be higher than the 7% currently allocated to procurement.
Transport and Travel
An initial estimate of our transport and travel emissions lies at 1,100 tCO2e in 2023. While there is a lot of uncertainty associated with this figure, the scale of these emissions is important to note. Together with emissions from food deliveries (based on data from Foodquad) and our college van, which are both estimated at 1 tCO2e per year, emissions from student and business travel are higher than all other currently calculated and estimated emissions combined. Emissions from flights for College business amounted to 53 tCO2e in 2023.
We have assumed that UK students travelled to Oxford by car, with a family member or friend dropping them in Oxford and then making the return trip home. For our calculations we included 100% of emissions for postgraduate students, rather than dividing their emissions equally between their University department and the College. For the purposes of estimating the CO2e emissions we assumed that the average return journey was 400 miles, equivalent to driving from Lancaster to Oxford and back. This equates to 174 tCO2e from our UK students travelling to and from Oxford (University of Oxford Carbon Accounting Tool 2020).
We assumed our international students on undergraduate and taught postgraduate courses made two return flights from their home country and that postgraduate students taking research degrees made one return flight from their country of origin. For our calculations we included 100% of emissions for postgraduate students, rather than dividing their emissions equally between their University department and the College. For the purposes of estimating emissions we assumed each student flew from the capital city of their country of residence to London and vice versa for return trips. This equates to 872 tCO2e from our international students travelling to and from the UK (University of Oxford Carbon Accounting Tool 2020).
Carbon removal
Land
Exeter owns and manages responsibly approximately 12 hectares of woodland and six hectares of grassland including a site of special scientific interest (SSSI). Together these absorbed approximately 74 tonnes of CO2e in 2021 (University of Oxford Carbon Accounting Tool 2020).